Can you hear the shape of a graph?
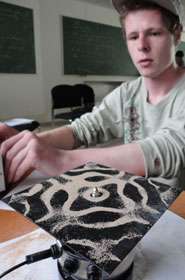
.jpg "The University of Bristol team members working on their exhibit at the Royal Society Summer Exhibition 2011. Image by Jasmin Meinecke/Oliver Sargent")
The Bristol exhibit focuses on quantum graphs, which can be thought of as a network of guitar strings tied to each other. When a system like this vibrates it produces a series of sounds with different pitches.
Visitors to the exhibition, which opens today, will be invited to create quantum graphs and check out their properties on a large multi-touch surface in the Bristol exhibit. Varying the number and length of the strings, and trying different ways to connect them will create different quantum graphs with their own spectrum of sounds.
Visitors will also be able to explore how this spectrum changes with the quantum graph, observe the vibrating strings of the graph and note that some special points of the strings do not move at all. These nodal points are a fascinating phenomenon and discovering their patterns is still an unsolved challenge.
The exhibit also asks whether a quantum graph can be rebuilt just from knowing its spectrum of sounds, that is: can you hear the shape of a graph? This riddle is known as an ‘inverse problem’, whereby indirect measurements help us see the shape of an object. Real world examples of inverse problems include radar, sonar and ultrasound.
Dr Ram Band, research assistant in Bristol’s School of Mathematics and the director of the project, said: “The idea of ‘seeing sound’ has captivated people for hundreds of years. In the late 18th century, a German physicist and musician, Ernst Chladni, delighted audiences with his demonstrations, pouring sand on a brass plate and making it vibrate using a violin bow. The sand arranged itself into beautiful patterns which astounded the people who came to see his lectures. We hope that visitors to our exhibit will be equally enthralled by the opportunity to see for themselves the beauty of quantum graphs.”
The Royal Society’s annual Summer Science Exhibition opens today. The scientists will be on hand at the exhibition, which runs from 5 July to 10 July, to talk to visitors about their research.
The Bristol exhibit was designed, planned and built entirely by students from the School of Mathematics and the School of Physics. The project was directed by the post-doctoral researcher Dr Ram Band, with the PhD student, Adam Sawicki as the deputy director and Dr Dane Comerford as the consultant. The team worked together on all aspects of the project from the initial planning to the final realisation of the exhibit.
The team members are: George Adje, Ram Band, Dane Comerford, Yating Deng, Orestis Georgiou, Joanna Hutchinson, Chris Joyner, Lionel Kameni, Maxim Kirsebom, Ben Leadbetter, Jasmin Meinecke, Andrew Poulton, Oliver Sargent, Adam Sawicki, Peter Shadbolt and Nick Simm.
Provided by University of Bristol


.jpg)


.jpg)


