Visualizing the flow of molten rock through seabed mantle

New information about how most of the Earth’s crust formed has been uncovered by investigators who utilized the Advanced Photon Source (APS) at Argonne National Laboratory to obtain unprecedented, three-dimensional x-ray images of melted rock. Their results, published in the journal Science, offer a more sophisticated picture of rock porosity and a resolution of the discrepancy between permeability and melt velocity.
Where the Earth's tectonic plates drift apart at ocean floor spreading centers, mantle rock partially melts and seeps upward, eventually solidifying to form new crust. Geologists have had difficulty reconciling estimates of the permeability of the partially molten mantle with analyses of the rate at which molten rock ascends. In microtomography experiments utilizing the X-ray Science Division beamline 2-BM at the U.S. Department of Energy Office of Science’s APS, a team of scientists from the Woods Hole Oceanographic Institution, the University of Western Australia, and Argonne has, for the first time, directly imaged the intricate network formed by the molten fraction within a mainly solid rock.
The Earth’s upper mantle consists mostly of olivine as well as other minerals with lower melting points. Using measurements of seismic wave speeds, geophysicists estimate that 1% to 2% of the mantle beneath seafloor locations at the East Pacific ocean ridge is in a molten state. This melt fraction implies that the permeability of these rocks is relatively low: The less permeable the mantle, the harder it is for buoyancy to drive the melted fraction upward, and the greater the amount of melt the mantle retains.
On the other hand, geochemical analyses of ocean-ridge basalts show that the relative abundances of uranium, thorium, and radium isotopes belonging to a single decay chain have not reached the long-term equilibrium values dictated by their half-lives. This contradicts the geophysical data, explains one of the Science article’s co-authors, Wenlu Zhu of the University of Maryland, since it implies that magma rose rapidly from great depths, which requires high permeability.
Adding to the confusion are analyses that predict, for given temperature and pressure and for known rock compositions, thermodynamically favored arrangements of solid and melted fractions. These arguments suggest melt fractions should be around 0.5% or lower.
“The weak link is using the thermodynamic model to guess rock structure,” said Zhu. Permeability depends on fine details of how the melted fraction within a rock connects together. Previous studies have attempted to infer the three-dimensional network of melted material from two-dimensional images of slices through a rock, but such analyses are ambiguous, especially at low melt fractions.
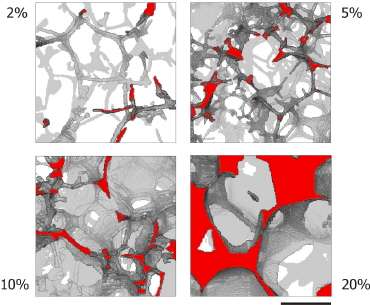
Zhu and her colleagues turned to x-ray studies of heated and compressed basalt to image directly the three-dimensional network formed at different melt fractions. Because the density contrast between the solid and melted fractions was small, they used an edge-enhancement technique to obtain Fresnel fringes from the liquid-solid boundaries in their millimeter-diameter sample. Rotating the sample through 180° in 0.12° increments allowed the team to build up three-dimensional microtomographic images with submicron resolution.
At four melt fractions, from 2% to 20%, the researchers see an interconnected network of melt channels running along the edges where three or more olivine grains meet, in broad agreement with thermodynamic predictions.
At higher melt fractions, however, the images show films of melted material coating the boundaries between adjacent grains, but these films are far less evident at lower melt fractions. “One has a nicely connected network of channels that controls the flow,” Zhu said, but “the structure is not as simple as models predicted.” That more complex structure changes the exponent in the power law relating permeability to grain size.
To understand why mantle rocks have a melt fraction of 2% rather than the lower figure predicted, Zhu suggests thinking of their structure as less like a sponge and more like a snowball.
“When you squeeze a sponge, it is very compliant,” she said, whereas a snowball is easy to squeeze at first but then becomes much harder as its solid particles are compacted together. In the same way, the matrix of highly compressed mantle grains resists compression so that the melt network between the grains doesn't feel so much pressure and therefore doesn’t flow as fast as expected. Geologists have sometimes wondered about this kind of behavior, Zhu says, but the new results show that it can't be ignored.
In the future, the researchers hope to image the rocks while they are heated and kept under pressure.
More information: Wenlu Zhu1, et al. "Microtomography of Partially Molten Rocks: Three-Dimensional Melt Distribution in Mantle Peridotite," Science 332, 88 (2011) DOI: 10.1126/science.1202221
Provided by Argonne National Laboratory


