January 27, 2012 feature
Stock market network reveals investor clustering

(PhysOrg.com) -- The stock price of a company continuously changes, going up or down depending on the collective activity of a large number of investors. Although this process seems fairly straightforward, no one fully understands how this collective trading activity finds the "correct" price of a stock. Some theoretical models have been proposed to describe how different investment strategies affect price dynamics, but challenges such as investor confidentiality and complicated data mining make it difficult to gather empirical support for these models.
Now in a new study, with access to a database of thousands of investors’ trading activity of Finnish stocks, researchers have developed a network that allows them to identify investor clustering, or groups of investors that trade in a similar way. Clustering, which can also be thought of as herding, may eventually lead to the identification of trading patterns and strategies that collectively determine stock price.
The team of researchers, Michele Tumminello, Fabrizio Lillo, Jyrki Piilo, and Rosario N. Mantegna, working at Palermo University in Palermo, Italy; Carnegie Mellon in Pittsburgh, Pennsylvania; Scuola Normale Superiore di Pisa in Pisa, Italy; the Santa Fe Institute in Santa Fe, New Mexico; and the University of Turku in Turun yliopisto, Finland, have published their study on identifying investor clustering in a recent issue of the New Journal of Physics.
Statistically significant similarities
The researchers gathered their data from a database that records the daily trading activity for almost all major publicly traded Finnish companies. Under a special agreement with Euroclear Finland, which maintains the database, the researchers were able to access data from 1995 to 2008.
The researchers focused on the trading activity of just one stock, Nokia, for a five-year period between 1998 and 2003 in all financial markets where the company is listed. During this time, 164,000 investors made more than 18 million transactions of Nokia. However, the researchers considered only those investors who traded Nokia stock on at least 20 days during the time period, reducing the number of investors to 11,000. These investors were responsible for 99.83% of the exchanged volume.

Overall, the investors were extremely diverse in terms of their investment size, trading capabilities, etc. The researchers classified investors into six categories: households (individuals), non-financial corporations, financial and insurance corporations, governmental organizations, non-profits, and foreign organizations. The researchers also described each investor’s type of daily trading activity as one of three states: buying, selling, or both.
Using this data, the researchers then created a statistically validated bipartite network, a relatively new type of network. They began by building a bipartite system, which has two types of nodes: investors and trading days. The two node types can be connected by one of three link types: buy, sell, or both. For example, if investor 1 buys stock on day 1, then a buy link would connect those two nodes. Often there is no link between an investor and a trading day because the investor did not trade that day.
In order to identify clusters of investors in this bipartite system, the researchers had to expand the system into a network of investors. Here, nodes only represent investors, and two investors can be connected by as many as nine different link types, since there are nine different combinations of two investors who each have three possible states. For example, one link type is when both investors buy on the same day, another is when both sell on the same day, another is when one buys and one sells, etc. Each link is weighted according to the number of days the two investors were described by the state characterizing that link. For example, when two investors are connected by a strongly weighted buy-buy link, it signifies that they both bought stock on the same days for many days.
In order for the researchers to determine the similarity between two investors’ trading activities, they had to figure out just how strongly weighted a link has to be to indicate significant similarity. To do this, the researchers had to statistically validate each link against a suitable “null hypothesis,” which represents a default position, or statistical threshold where some similarity is expected. So when two investors’ trading activity is similar for more days than expected by the null hypothesis, the similarity rejects the null hypothesis and is statistically valid. There can be nine different types of these statistically valid similarities, or “co-occurrences,” as described above.
Interpreting clusters
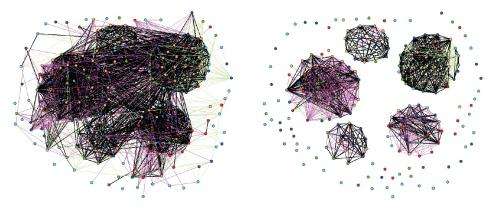
When the researchers finished constructing this network (using two different statistical validation methods), the results showed that trading activity often occurs in clusters characterized by different types of co-occurrences. Both methods produced more than 300 clusters ranging in size from 2 investors to 500 investors in one method and 3,000 in the other. Within these clusters, investors traded in similar ways, with some clusters buying on the same days (buy-buy co-occurrence), some selling on the same days (sell-sell co-occurrence), and some doing both (combination buy-buy and sell-sell co-occurrence), etc. Interestingly, some clusters were dominated by investors belonging to specific categories. For example, household (individual) investors were over-expressed in a cluster characterized by buying on the same day, while financial and insurance corporations were over-expressed in a cluster characterized by selling on the same day.
“I believe that the most interesting result is that in some clusters of investors we detect an over-representation of some types of investors – household, financial institution, etc. – belonging to it,” Mantegna told PhysOrg.com.
The researchers also demonstrated that the statistically validated networks are not dependent on the length of the time period, and can be applied to shorter segments within the five-year period. They split this period into two segments: the bull period of 1998 to mid-2000 and the bear period of mid-2000 to 2003. Counterintuitively, both statistical methods identified a sell-sell co-occurrence in the bull period and a combination sell-sell and buy-buy co-occurrence in the bear period. This finding defies the intuitive expectation that the sell-sell co-occurrence should dominate the bear period more than the bull period.
Applied to even shorter time periods, the more stringent of the two methods detected that trading activity changes in response to certain events. For example, trading activity increases after a stock splits and immediately after quarterly announcements. These observations can likely be attributed to the sensitivity of these statistically validated networks.
“There are at least three main differences between our network and previous financial networks,” Mantegna said. “First of all, our network is the first one that has been proposed to describe the investment activity of single investors, including households, trading in a financial market. Second, our method is able to properly account for the heterogeneity of investors' activity. In fact, differently from other approaches using correlation estimates among the inventory variation of single investors, our method works for single investors being active traders in a number of days ranging from 20 to 1,300, in other words a degree of heterogeneity of about two orders of magnitude in trading frequency. Finally our method is capable of detecting not only either correlation or anti-correlation between investors' activity, but also mixed relationships between investors' strategies, like for example a significant correlation of selling activity and, at the same time, a correlation of a day trading like buying and selling activity for the same pair of investors.”
Overall, the results show that investors who are diverse in many ways still exhibit synchronized trading activity. In the future, the researchers plan to investigate the underlying causes of this synchronization, such as the use of similar strategies, influence from analysts, or communication among the investors themselves. The discoveries from such studies could lead to a better understanding of the dynamics of complex financial systems.
“From our perspective, a key scientific question is whether an essential heterogeneity, or in other words an ecology of traders, is needed or not to observe an efficient price discovery process in financial markets,” Mantegna said. “In current economic theory, heterogeneity is summed up into a representative agent, but there is growing evidence that not all the heterogeneity can be reflected into the global action of a single rational agent.”
Besides understanding markets on a large scale, this network could also have applications for investigating activity such as high-frequency trading with the potential to detect fraudulent patterns.
“We have adapted this method to work at the level of a trade network of market members and/or single institutions trading at high frequency,” Mantegna said. “When high-frequency data are available, the method can identify regularities and patterns (not necessarily fraudulent behavior) in the high-frequency trading activity of market members and single investors. The method per se does not detect fraudulent trading activity but rather detects co-occurrences of trading activities in a robust statistical way. If there is a pattern of trading considered fraudulent by other means it might detect all the investors that have followed that pattern of trading irrespectively of their trading frequency (provided that it is not too low).”
More information: Michele Tumminello, et al. “Identification of clusters of investors from their real trading activity in a financial market.” New Journal of Physics 14 (2012) 013041. DOI: 10.1088/1367-2630/14/1/013041
Journal information: New Journal of Physics
Copyright 2012 PhysOrg.com.
All rights reserved. This material may not be published, broadcast, rewritten or redistributed in whole or part without the express written permission of PhysOrg.com.


