NASA Research Finds Last Decade was Warmest on Record, 2009 One of Warmest Years
January 21, 2010
(PhysOrg.com) -- A new analysis of global surface temperatures by NASA scientists finds the past year was tied for the second warmest since 1880. In the Southern Hemisphere, 2009 was the warmest year on record.
Although 2008 was the coolest year of the decade because of a strong La Nina that cooled the tropical Pacific Ocean, 2009 saw a return to a near-record global temperatures as the La Nina diminished, according to the new analysis by NASA's Goddard Institute for Space Studies (GISS) in New York. The past year was a small fraction of a degree cooler than 2005, the warmest on record, putting 2009 in a virtual tie with a cluster of other years --1998, 2002, 2003, 2006, and 2007 -- for the second warmest on record.
"There's always interest in the annual temperature numbers and a given year's ranking, but the ranking often misses the point," said James Hansen, GISS director. "There's substantial year-to-year variability of global temperature caused by the tropical El Nino-La Nina cycle. When we average temperature over five or ten years to minimize that variability, we find global warming is continuing unabated."
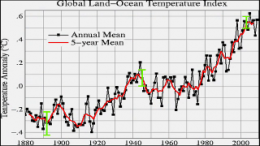
January 2000 to December 2009 was the warmest decade on record. Looking back to 1880, when modern scientific instrumentation became available to monitor temperatures precisely, a clear warming trend is present, although there was a leveling off between the 1940s and 1970s.
This video is not supported by your browser at this time.
Credit: NASA/Goddard Space Flight Center
In the past three decades, the GISS surface temperature record shows an upward trend of about 0.36 degrees F (0.2 degrees C) per decade. In total, average global temperatures have increased by about 1.5 degrees F (0.8 degrees C) since 1880."That's the important number to keep in mind," said GISS climatologist Gavin Schmidt. "The difference between the second and sixth warmest years is trivial because the known uncertainty in the temperature measurement is larger than some of the differences between the warmest years."
The near-record global temperatures of 2009 occurred despite an unseasonably cool December in much of North America. High air pressures from the Arctic decreased the east-west flow of the jet stream, while increasing its tendency to blow from north to south. The result was an unusual effect that caused frigid air from the Arctic to rush into North America and warmer mid-latitude air to shift toward the north. This left North America cooler than normal, while the Arctic was warmer than normal.
"The contiguous 48 states cover only 1.5 percent of the world area, so the United States' temperature does not affect the global temperature much," Hansen said.
GISS uses publicly available data from three sources to conduct its temperature analysis. The sources are weather data from more than a thousand meteorological stations around the world, satellite observations of sea surface temperatures, and Antarctic research station measurements.
Other research groups also track global temperature trends but use different analysis techniques. The Met Office Hadley Centre in the United Kingdom uses similar input measurements as GISS, for example, but it omits large areas of the Arctic and Antarctic where monitoring stations are sparse.
The map shows temperature changes for the last decade -- January 2000 to December 2009 -- relative to the 1951-1980 mean. Warmer areas are in red, cooler areas in blue. The largest temperature increases occurred in the Arctic and a portion of Antarctica. Credit: NASA
Although the two methods produce slightly differing results in the annual rankings, the decadal trends in the two records are essentially identical."There's a contradiction between the results shown here and popular perceptions about climate trends," Hansen said. "In the last decade, global warming has not stopped."
-
2008 Was Earth's Coolest Year Since 2000
Feb 23, 2009 |
not rated yet |
0
-
2007 was tied as Earth's second warmest year
Jan 16, 2008 |
not rated yet |
0
-
Winter Season Off To Record Warm Start
Jan 05, 2007 |
not rated yet |
0
-
Worlds oceans warmest on record this summer
Sep 16, 2009 |
not rated yet |
0
-
U.K. scientists say 2005 hottest ever
Dec 16, 2005 |
not rated yet |
0
-
Engineers build first sub-10-nm carbon nanotube transistor
Feb 01, 2012 |
4.9 / 5 (31) |
30
-
Something old, something new: Evolution and the structural divergence of duplicate genes
Jan 31, 2012 |
4.6 / 5 (7) |
1
-
The hidden nanoworld of ice crystals: Revealing the dynamic behavior of quasi-liquid layers
Jan 30, 2012 |
5 / 5 (3) |
1
-
Stock market network reveals investor clustering
Jan 27, 2012 |
3.9 / 5 (23) |
8
-
Of microchemistry and molecules: Electronic microfluidic device synthesizes biocompatible probes
Jan 26, 2012 |
5 / 5 (1) |
0
-
Discrepancy between oxygen and carbon-dioxide levels
Feb 09, 2012
-
where gems are found in the world
Feb 09, 2012
-
Wind Waves in Reservoir ~ Wind run-up and Wind set-up
Feb 08, 2012
-
Balance of oxygen in the atmosphere
Feb 01, 2012
-
The case for a methanol-based economy
Jan 30, 2012
-
Weather in a rotating cylinder
Jan 25, 2012
- More from Physics Forums - Earth
More news stories
Humans may have helped the decline of African rainforests 3000 years ago
(PhysOrg.com) -- Large areas of rainforests in Central Africa mysteriously disappeared over three thousand years ago, to be replaced by savannas. The prevailing theory has been that the cause was a change ...
Could Venus be shifting gear?
(PhysOrg.com) -- ESAs Venus Express spacecraft has discovered that our cloud-covered neighbour spins a little slower than previously measured. Peering through the dense atmosphere in the infrared, the ...
Space & Earth / Space Exploration
13 hours ago |
5 / 5 (7) |
7
|
NASA budget will axe Mars deal with Europe: scientists
US President Barack Obama's budget proposal to be submitted next week for 2013 will cut NASA's budget by 20 percent and eliminate a major partnership with Europe on Mars exploration, scientists said Thursday.
Space & Earth / Space Exploration
16 hours ago |
5 / 5 (2) |
18
Mars Science Laboratory computer issue resolved
(PhysOrg.com) -- Engineers have found the root cause of a computer reset that occurred two months ago on NASA's Mars Science Laboratory and have determined how to correct it.
Space & Earth / Space Exploration
14 hours ago |
4.7 / 5 (6) |
3
|
NASA sees wide-eyed cyclone Jasmine
Cyclone Jasmine's eye has opened wider on NASA satellite imagery, as it moves through the Southern Pacific Ocean.
Space & Earth / Earth Sciences
5 hours ago |
3.5 / 5 (2) |
1
Google users warned of threat to smartphone wallets
Users of Google smartphone wallets were being warned on Friday that there is a way to crack pass codes intended to thwart thieves from going on illicit shopping sprees.
Anonymous knocks CIA website offline (Update)
The website of the Central Intelligence Agency was inaccessible on Friday after the hacker group Anonymous claimed to have knocked it offline.
New error-correcting codes guarantee the fastest possible rate of data transmission
Error-correcting codes are one of the triumphs of the digital age. Theyre a way of encoding information so that it can be transmitted across a communication channel such as an optical fiber o ...
Complex wiring of the nervous system may rely on a just a handful of genes and proteins
Researchers at the Salk Institute have discovered a startling feature of early brain development that helps to explain how complex neuron wiring patterns are programmed using just a handful of critical genes. ...
The power of estrogen -- male snakes attract other males
A new study has shown that boosting the estrogen levels of male garter snakes causes them to secrete the same pheromones that females use to attract suitors, and turned the males into just about the sexiest ...
New power source discovered
(PhysOrg.com) -- Researchers at the Massachusetts Institute of Technology (MIT) and RMIT University have made a breakthrough in energy storage and power generation.

Jan 21, 2010
Rank: 3 / 5 (25)
These politicians, they're clearly not scientists by definition, continue on as if no one is wise to their exposed manipulation of methods and data, and attempted ostracization of real scientists who don't buy into their scam.
Jan 21, 2010
Rank: 2.7 / 5 (27)
But, we also have to consider the Atlantic anomaly that shot temperatures for the last two years up during the time it was active, causing Europe to be hit with Sahara Desert air. One wonders whether the Met corrected for that anomaly.
In addition, if we take the line back to 5,000 years, as shown in GISP2 and other related proxy data, we see that we are overall doing just fine by comparison.
Temps were warmer then than now and we are now in the midst of a cycle that still has not taken us up to the temperatures of that early time period.
Jan 21, 2010
Rank: 3.1 / 5 (17)
Jan 21, 2010
Rank: 2.9 / 5 (15)
Jan 21, 2010
Rank: 3.1 / 5 (26)
Incidentally the so called cooling trend for the last decade is no more, here is a plot of the global mean since 2000 hmmm, seems to be going up, not exactly a decline..ohh and just for fun I added the solar irradiance levels...wow...thats a decline! http://www.woodfo...set:1366
Jan 21, 2010
Rank: 3 / 5 (28)
Jan 21, 2010
Rank: 2.5 / 5 (19)
Oh Pheiankell and Veianarris, please explain how a mean temperature is at all relevant within the boundaries of climate science considering the system is positively not decadally linked according to your data set.
Jan 21, 2010
Rank: 2.9 / 5 (22)
I am pretty sure that 99.9 per cent of all the people that frequent this site -much less post comments- are aware that "mean" in this context equates with average. Therefore, when one speaks of "global" warming, the only numbers that speak to that in a meaningful way are perforce "mean" or "average"- in the sense of "GLOBAL"/"OVERALL".
The science itself is unequivocal. We are indeed experiencing Global Warming. The only question remaining is: is it, in fact, caused or exacebated by human activity? Since we are currently at solar minimum, and the variation in Earth's orbit is taking the northern hemisphere further away from the summer sun, my vote is for "yes".
Jan 21, 2010
Rank: 2.8 / 5 (24)
The mean being discussed is not a mean, or average.
Here's where it ceases to be a mean. When you generate pre-populated data points based off of an interpretation of signal from a non-local source it becomes a modal score through the manipulation. You're not discussing a mean value as one cannot create a mean value over the globe with our current equipment missing as many like measured data points as it is.
And if you haven't noticed, the Northern hemisphere is frozen solid. It's mighty cold up here.
Jan 21, 2010
Rank: 2.8 / 5 (23)
Anything relying heavily on CRU data is a complete redo, recheck, and reassessment, and until that is done no one should rely on the information. That includes reliance on the woods for trees website.
Jan 21, 2010
Rank: 2.5 / 5 (14)
This is very interesting. Since we are in a period of global cooling, and have been for more than the last decade - does this mean that there never was any global warming. (Ignore your data and look at objective data at http://www.friend...nce.org)
And although Ontario is twice the size of the biggest state, it is relatively small. So we should also consider the cold across Quebec, the Eastern U.S. etc. Also, the record snow and temps in England and in Europe, not to mention China, Russia, etc.
Jan 21, 2010
Rank: 2.3 / 5 (15)
Probably just a sockpuppet conspiracy, though.
Jan 22, 2010
Rank: 2 / 5 (15)
Jan 22, 2010
Rank: 2.1 / 5 (14)
You should not expect Seattle to be any different.
Jan 22, 2010
Rank: 3.6 / 5 (16)
Jan 22, 2010
Rank: 2 / 5 (12)
Jan 22, 2010
Rank: 3.4 / 5 (14)
I see someone still thinks the last decade showed global cooling, I'd love to see the evidence, (S)he mentioned the low temperatures but very high anomalous temperatures were recorded globally including Australia, Greenland and also not forgetting the highest ever temperature recorded for Europe in January (30C in Crete).
Jan 22, 2010
Rank: 3.6 / 5 (14)
so how do you explain the satellite recorded temperatures mentioned above...Vertical UHI...badly placed satellites? I notice Dachpy also says on one hand the data is a joke, can't trust it, then tells us with all authority that temperatures have been in decline the last decade...using what data...we want to see it...show us the links...
Jan 22, 2010
Rank: 3.1 / 5 (17)
Doesn't take long to bring in Climategate does it? When all things fail bring in the handful of cherrypicked, non contextual emails (6 out of over a 1,000?) to disprove every climate argument...pathetic
Jan 22, 2010
Rank: 1.8 / 5 (15)
Climategate shows there is a need for investigation into the data that the CRU produced. That investigation would determine the truth of the matter.
Couple this with Mr. Pachauri's indiscretions and there's even more reason for healthy skepticism.
If the satellite data was beyond doubt perhaps they would use it in these annoucements of record temperature, instead of using the ground based stations and reporting based on that equipment.
You keep stating they match, prove it. Everyone else seems to doubt correlation without manipulation, including the reviewers.
Jan 22, 2010
Rank: 2.6 / 5 (11)
Jan 22, 2010
Rank: 3.5 / 5 (8)
Jan 22, 2010
Rank: 2.1 / 5 (15)
It is well known that surface temperatures are increasing due to the heat island effect. Satellite data does not show the same increase. These "scientists" have put blinders on. NASA and the CRU are working together to fudge the evidence any way they can. Disgusting. And the mainstream media still writes articles about this garbage as if it were real science.
Jan 22, 2010
Rank: 3.5 / 5 (13)
Jan 22, 2010
Rank: 3.4 / 5 (17)
By the way satellite data does show the same increases (check out links above) you just need to look at the information instead of relying on nutjob blogs for your info.
Jan 22, 2010
Rank: 3.7 / 5 (15)
Jan 22, 2010
Rank: 3.7 / 5 (9)
Theories must correlate to fact, otherwise they are naught but speculation and conjecture.
I've seen rather compelling reports for global warming _and_ for global cooling. Our problem has now become understanding the datasets used.
If I use a statistical analysis and pick my numbers right, I can "prove" just about anything.
Politics and emotion should be cut out. I suggest you all seriously investigate _both_ sides of the argument. It can give insight.
Discussion can lead to understanding, but argument generally leads to disagreement.
Jan 22, 2010
Rank: 2.3 / 5 (12)
My personal belief, is that global warming will lead to more prosperity. IMHO, we're wasting resources assuming what we're doing is changing the weather, and assuming that the supposed change is a negative thing. We do know weather changes. Humans didn't cause the ice ages or warming periods that occurred in the past. We should expect change.
Jan 22, 2010
Rank: 5 / 5 (8)
I have seen no indication of Polish people melting. Though one young Pole was quite a lady, she melted my heart.
Jan 22, 2010
Rank: 1 / 5 (3)
Jan 22, 2010
Rank: 2.3 / 5 (12)
Sahra Palin will gain nothing from her stance about AGW being a myth.
Al Gore will/has made a forturne on AGW.
Scientists who are against AGW are marginalized and ridiculed by the media and may loose funding and will be prevented from publishing their findings.
Scientists who promote AGW are getting funding, are held up by the media.
Jan 22, 2010
Rank: 2 / 5 (12)
In spite of the fact that everything that comes from CRU is suspect until all information is rechecked (with the exception of the raw data that disappeared and never will be recovered, of course), I thought I would take a few moments to post a link to the same woodfortrees website and this time remove the noise from the graphs by limiting the time from 2001 (the point where the cooling trend actually began this decade) to what is barely available of 2010 and setting up a Linear Trend (OLS) for all lines of data I chose to use. Take a look:
http://www.woodfo...10/trend
9 years out of this decade is a downward slope. Thoughts?
Jan 22, 2010
Rank: 2.1 / 5 (11)
But, something should be made clear at the outset. Neither the numbers the sockpuppets have linked nor mine are considered statistically significant overall.
I also want to remind everyone of the overall trend over the last 5000 year or so as well, as reported via GISP2.
http://www.ncdc.n...2000.gif
I think we are doing just fine for the moment by comparison when we take a step back and look at the bigger picture. It really is where the lines are drawn at this stage of data acquisition and debate. :)
Jan 22, 2010
Rank: 1.4 / 5 (9)
That was Monday, October 26, 2009.
I really would like to compare the trend data again on a global level and set the parameters for the original 1979-2000 mean and compare that to the US data.
Last time I checked, the data pretty much showed what the link to the wood for trees site in two posts directly above shows when a Linear Trend is set up for the majority of the last decade. It is quite pertinent to the above article, but, unfortunately, it still is unavailable to the public.
Jan 22, 2010
Rank: 2.5 / 5 (8)
http://www.nerc-b...rend.pdf
Those are individual stations not affected by UHI, "adjustments". They are located in perfect place where there is no day-night time temperature variation noise. Remarkably flat, aren't they?
Jan 23, 2010
Rank: 2.1 / 5 (11)
The Amundsen-Scott station is located at 90°00'S, 0°00', South Pole, East Antarctica.
The Vostok station is located at 78°27'S, 106°52'E, central ice plateau, East Antarctica.
I also observe the relatively 'flat' format of the data.
Jan 23, 2010
Rank: not rated yet
Jan 23, 2010
Rank: 4.1 / 5 (9)
Here's your answer:
http://www.woodfo...10/trend
Plotted is the data for sea surface temp anomaly -- both raw and linear fit. You will notice a rather large (and uncharacteristic) drop in temperature during 2008. That was a significant La Nina. If that year were to be excluded, the slope of the line fit would flip to positive. And oh by the way, 2010 is projected (and already is proving to be) quite a strong El Nino year -- so by this time in 2011 your decadal plots will start to look very different, as 2008 is balanced out by 2010.
And oh by the way, 2008-2009 corresponded to the activity minimum in the 11-year solar cycle. We're headed toward an upswing now:
http://www.swpc.n.../f10.gif
Enough thoughts for you yet?
Jan 23, 2010
Rank: 1.4 / 5 (9)
In addition, I smoothed out 2008 in one of my own experimental charts on my own computer and still showed an overall declining trend. It may be smaller but it still showed a decline. I will need to play with the numbers and parameters to see whether the chart you have shared with us can be set up similarly.
Unfortunately, if we want to discuss the finer and more exacting details of the case for the data you used, we will have to wait until it all becomes available. It still is not as of yet.
As to the solar cycle, the outcome of that prediction remains to be seen. We have been told repeatedly that we are going to be headed toward an upswing and that solar activity was going to ramp up for most of last year. Like that ever happened... :)
Jan 23, 2010
Rank: 3.4 / 5 (10)
The last decade was the warmest recorded....period.
I love this quote from above "
In addition, I smoothed out 2008 in one of my own experimental charts on my own computer and still showed an overall declining trend."
From someone who makes such a huge fuss about experimenting with code/hiding declines etc..here we see exactly the same!! Hide your emails, this might be taken totally out of context and used against you!
Jan 23, 2010
Rank: 4.6 / 5 (9)
The data (and charts) are from the same web site YOU used.
And here's another point:
http://www.woodfo...10/trend
This time, plotting the same raw data, with same type of linear fit. But instead of the last 10 years, I chose to plot the last half-century (i.e. from 1960 to 2010.)
Looking at the trendline, and the deviations from it (i.e. "noise") on the finer scale, what happened between 2000 and 2010 is completely within the norms of the noise. There is no signal there. There is no "decline". IOW you could find other "declines" if you focused on 1987-1996, or on 1969-1975. But that's nothing other than a case of intentional fraud, which one could loosely describe as "deliberately selective attention".
Jan 23, 2010
Rank: 1.5 / 5 (8)
Furthermore, I also stated that the data could not be trusted until checked and rechecked. It came from the CRU, for crying out loud.
I also stated in one of the now hidden posts above that I did it for a "fun exercise" and for no other reason. I have clearly stated several times here and elsewhere that the woodfortrees data must be taken with a grain of salt. I also have clearly stated that my linked material from that site is statistically insignificant. What part of that do you not understand? Please try to read a little more carefully.
Of course, I can see how you might have missed something like that in light of the sockpuppeteer's penchant for downranking posts he doesn't like. Nonetheless, if you read the above now hidden posts you might actually begin to understand. If not, I cannot help you.
Jan 23, 2010
Rank: 1.9 / 5 (9)
This is exactly why no one here or elsewhere will ever see my chart. I only mentioned that I did it but I have no intention of publishing a flawed model or a flawed chart based on flawed, possibly tainted, and missing data.
Too bad the CRU and IPCC did not learn that lesson earlier when they went ahead and actually used the code and published information based upon it. :)
Jan 24, 2010
Rank: 4.5 / 5 (8)
So the observations are sound. The climate is warming. Glaciers are retreating for the most part. In the much ballyhooed 'climategate' emails, what is usually left out of the discussion is that all of the dissenting papers (the ones that people were supposed to have suppressed) made it into the final report. In addition. the 'trick' was to use actual observed data instead of tree-ring proxy data. Not exactly what I would call evidence of some global conspiracy to suppress what is true.
There is simply no data supporting any of the AGW deniers positions. It is all made up. You guys are simply wrong.
Jan 24, 2010
Rank: 4.5 / 5 (8)
So your position is that this is a total scam because you can only see 1/3 of the warming in this report... because you fail to understand how trivial it is to accurately measure and adjust for the heat island effect? Interesting position. Are you just standing there on one leg or is there actually room for both feet?
Jan 24, 2010
Rank: 4.4 / 5 (7)
links? data? or is this more smoke?
Jan 24, 2010
Rank: 3.7 / 5 (9)
So even if criminals steal your unfinished data with your experimenting, unfinished, presumably with warning notices to ensure they don't make it into the finished article, publish it for the benefit of like-minded extremists without any link or reference to the actual code you used, you would say that was OK?
Show us a link to the finished code, with contextual correspondence then, or is 'hidden' in the parts of the emails you admit to have not read thoroughly?
Jan 24, 2010
Rank: 2.3 / 5 (9)
Jan 24, 2010
Rank: 1.9 / 5 (9)
Dairy farms in Greenland and Vineyards in Scotland are a fact of history.
In 2009 (and 2010, 11 12 . . .) it is still too cold for these to exist where once they did.
AGW = hogwash.
Jan 24, 2010
Rank: 3.7 / 5 (9)
All evidence suggests that the MWP and the LIA were not global (to clarify one point the 'year without a summer' was caused by a large eruption).
As regards Scottish vinyards, well, you are basing this assumption on one unverified and controversial report. I think it quite comical you trust an unsubstantiated report, highlighted in nutjob blog, as evidence yet ignore the thousands of papers in the last 30 or so years.
Anyway, wine was produced in England back in the Romans time, they hated it as the quality was quite poor (as verified from relics found at Hadrian's Wall)and imported the vast majority of their consumption from Italy. English wine today is actually very, very good, helped by good grape selection and warm summers!
Jan 24, 2010
Rank: 1.7 / 5 (6)
What about these two graphs (taken from your original objection about the La Nina in 2008), comparing ocean surface sea from 1990-2000, if we eliminate the 1997/1998 strong El Nino that cause a huge spike in temps, we get a negative trend or a flat one at best?
http://www.woodfo...00/trend
Also, I haven't seen any refutation for the GISP2 historic trend from ice cores OR the flatness of temperatures at stations in Antarctica?
Are there any reasons why we should dismiss this data or consider it irrelevant to the issue? Stuff like this needs to be refuted to the general public, if anyone hopes to be able to give any credibility to AGW, which is on very shaky stilts as it is.
I will also adhere to the general opinion that all this bickering, accusation and franticness is one of the worst soap operas that science has ever been in, and it is SAD!
Jan 24, 2010
Rank: 4.6 / 5 (9)
This is why focusing on any single decade, when rather large fluctuations to either side of the long-term trend exist on multi-year time scales, is a fundamental error in approach. Yes, you're right that 1998 skewed the trend for the 1990-2000 interval, just as 2008 skewed 2000-2009. That's exactly my point: if you want to see the long-term trend, you have to measure it over a time period that exceeds random fluctuation time scale by at least an order of magnitude, and hopefully more.
Not sure what you're talking about; can you update me on that?
Antarctic *polar* temperatures are exceptional due to the fact that the air mass over that continent is effectively isolated from the rest of the globe for much of the year, due to a strong and stable circumpolar flow (the polar vortex):
http://en.wikiped...r_vortex
Jan 24, 2010
Rank: 1 / 5 (6)
You mean CO2 concentration there stays at preindustrial level? Therefore, there is no way for that evil greenhouse gas to have an effect during long summers?
Jan 24, 2010
Rank: 4.9 / 5 (9)
Let's review how "evil greenhouse gas" produces its effect. You see, the sun hits the GROUND, which absorbs the sunlight and warms up the air next to the ground, as well as radiating the heat back in the infrared. It is this heat both directly radiated and transferred to lower troposphere, that is then trapped by greenhouse gases.
In Antarctica, the sun hits the ground at extremely slanted angle: thus, imparting less heating. Moreover, the sun hits a ground covered by snow and ice: highly reflective surface, that absorbs very little of the sunlight. Most of the sunlight is reflected directly back to space, instead of being converted to heat. IOW, "high albedo."
With these conditions in mind, greenhouse gases would exert much less of an effect over Antarctica. Any other blindingly obvious things you need explained?
Jan 25, 2010
Rank: 1.5 / 5 (8)
Since water vapor accounts for 95% of the greenhouse effect, and CO2 accounts for 0.28% of the effect, and there is no causative link between CO2 and temperature (temperature rises cause increases in CO2, not the other way around) how do we justify massive global programs to control CO2? That seems blindingly obvious, so explain it.
Jan 25, 2010
Rank: 1 / 5 (7)
May I suggest a new theme, asteroid attack. It parallels global warming fairly well, only it is even less provable than GW (ie you can hide the decline without being caught). You can scare the general population with dire predictions of disaster and get to the "asteroid tax" faster than the "carbon tax".
Same premise, same end result....soak the working stiff.
Free the scientists.
Jan 25, 2010
Rank: 1 / 5 (8)
Source: http://data.giss....gistemp/
Jan 25, 2010
Rank: 1 / 5 (8)
No.
"the Medieval Warm Period of 800 to 1300 A.D. and the Little Ice Age of 1300 to 1900 A.D. were worldwide phenomena"
www.cfa.harvard.e...0310.htm
Jan 25, 2010
Rank: 1 / 5 (8)
yes
Jan 25, 2010
Rank: 1.4 / 5 (9)
The link is above and has been for some time--in a now hidden post. Turn off rank filtering and you will see it. It is a link to charted GISP2 data above, and it is on a NASA affiliated site. Again, it would be most helpful to actually read what I have posted above.
Jan 25, 2010
Rank: 1.4 / 5 (10)
There never will be any person, criminal or otherwise, who will ever see that chart. I deleted it and I tend to do a better than DOD-standard wipe on deleted data. Good luck to anyone trying to get at something like that. :)
As to the emails and data, there is plenty of context. You just haven't seen it because the only thing you are doing is banking off of climate blogs denying that it is there. The 'e' revision code was and is fully functional, was actually used, and fudges data as its stated purpose details--it applies a very artificial correction to remove declines from multiple kinds of data.
Want a link? Pick for us a site you will accept.
Jan 25, 2010
Rank: 1.4 / 5 (9)
Your link was broken. I attempt to fix the link here:
http://www.cfa.ha...310.html
It is quite useful information. Thanks for sharing.
Jan 25, 2010
Rank: 4.6 / 5 (10)
http://en.wikiped...troversy
Jan 25, 2010
Rank: 1.4 / 5 (9)
Never trust wiki for anything at all controversial. Might as well trust algore.
Jan 25, 2010
Rank: 5 / 5 (8)
You can't artificially raise the amount of water in the atmosphere, as it is limited by the air's temperature. Excess water rapidly precipitates out. Water as a greenhouse gas is also only effective in the troposphere. In the upper atmosphere, water is 1) much less abundant (due to much colder temperatures), 2) tends to form ice crystals instead of vapor.
For CO2, there is no natural limit on concentration in the atmosphere, it is equally effective at any altitude, and equally potent regardless of absolute or relative humidity of any climate.
Because in the past, there was no anthropogenic CO2. Warming due to other causes tends to release extra CO2 from solution (out of oceans) into atmosphere. Raising CO2 content in atmosphere still boosts the effectiveness of the atmospheric blanket, regardless of what caused the increased concentration.
Jan 25, 2010
Rank: 1.5 / 5 (8)
Thanks! We all have to work to stop the madness.
Jan 25, 2010
Rank: 3.3 / 5 (3)
That's been my point all along too - well said, PE. I did some research (unrelated to climate, but bear with me) where I gathered and plotted data points, and my rule of thumb was if the removal of one or two points altered the curve too much, then I needed more data. The same applies here - if you remove a "problematic" data point (year) and it completely reverses the overall trend, then your data is not representative of anything significant. It's just noise. Collect more data, and you'll have real results.
Jan 25, 2010
Rank: 1.5 / 5 (10)
Easier way to say it. For every 1 degree rise in temperature, to reach another degree you require an exponentially greater amount. So the warming you get by adding 100pm will not be mirrored by adding another 100ppm. Eventually you will reach a point where any additional CO2 will be negligible in it's delta on forcing.
As a secondary, the molar mass of CO2 is what makes CO2 only of relevance within the troposphere.
Water vapor is pertinent at all levels due to how water works as a prism on incomming and outgoing light as well as how its state change results in a change in forcing and albedo. Couple this with the fact that precipitation acts as a carbon sink and your explanation is easily deemed over simplistic.
Jan 25, 2010
Rank: 1.5 / 5 (10)
Does anyone actually pay attention to the star ranking system? Does it matter?
Jan 25, 2010
Rank: 5 / 5 (8)
The saturation effect (i.e. logarithmic relationship between volume fraction and radiation blocking) is taken into account when calculating total effect of increased CO2.
The molar mass isn't as important as you think. The convection currents within the atmosphere completely dominate what otherwise would be the tendency of the various gases to sort themselves by weight. In terms of its gas content by volume fraction, the atmosphere tends to be well-mixed at any altitude.
"Precipitation as carbon sink": I don't know if you've heard, but atmospheric volume fraction of CO2 is on the rise. Clearly, it isn't "precipitating out" fast enough.
Jan 25, 2010
Rank: 1.1 / 5 (8)
If the atmosphere was well mixed at any altitude you wouldn't see distinctive layering within the atmosphere in both gas and energy content. Gas is well mixed within the troposphere but that changes significantly once you rise above the tropopause.
And I'm not confusing concentration with optical saturation. For a given amount of CO2 you have a total "delay" between emission and escape of the energy. At 100ppm it's 1 unit, at 200ppm it's 2 units, at 400ppm it's 3 units. It is not as simple as "add 100ppm and get a 1 degree increase".
As for precipitation as a carbon sink, you say more water vapor would precipitate out quickly, would that not establish a method of "atmos-statis" at a certain point?
Jan 25, 2010
Rank: 4.9 / 5 (8)
http://adsabs.har....7..873M
How will that carbon be fixed on the surface? CO2 is in equilibrium between atmosphere and bodies of water. You can't add any more of it without it outgassing back into the air. In fact, the warmer the temperatures, the less CO2 can remain dissolved in water. That's why paleo-warming always lead to CO2 outgassing and increased concentrations in air -- as opposed to scrubbing of CO2.
But nobody seriously asserts that equilibrium will be lost forever. The concern is that the new equilibrium is at disruptively higher ground and tropospheric temperatures.
Jan 25, 2010
Rank: 1 / 5 (7)
I don't believe the system is so fragile that we are having any great effect. However, we should be preventing pollution and cease despoiling the land. Carbon is the least of our worries.
And as for ozone, it's aloft due to it's charge and where it's generated. Not convective pressure. Just about all the CO2 in the atmosphere is located in the troposphere. The atmosphere is not well mixed between charge layers. The incomming energy and the capacity for absorption along independant spectra of differening molecules ensure that.
Jan 25, 2010
Rank: 5 / 5 (7)
The problem is that this shift is quite rapid for ecosystems, which are already under stress from us as it is. It is also a sufficiently large shift to disrupt local climate patterns, shift wind patterns, redistribute precipitation, raise sea levels, etc. -- wreaking unknown but probably huge amounts of damage and expense. In biological terms, consider also the difference between 36.5 C vs. 40.5 C. The former is normal human body temperature; the latter is near-terminal high fever (terminal if sustained.) Sometimes, just a couple of degrees makes a huge difference...
Jan 25, 2010
Rank: 4.9 / 5 (7)
Take a look at the abstract I linked, as an example. In the stratosphere, they found rapidly fluctuating concentrations of CO2, that in relative terms were actually greater than in the troposphere. On one night, they measured 400 ppm CO2 in the stratosphere...
You can always do a web search for more examples; that's how I found that particular abstract, and there were others.
Jan 25, 2010
Rank: 1 / 5 (3)
Regarding albedo, you imply there shouldnt be any temperature increase at all? How about the hallmark paper
http://tintin.col...1978.pdf
predicted 5 degree temperature increase at latitude 80 deg. They also point that greenhouse effect is magnified at high latitudes. What were they smoking?
Jan 25, 2010
Rank: 5 / 5 (7)
But anyway, were they talking about the Arctic, or Antarctica? The polar vortex at the Arctic is a lot weaker and less organized, so there isn't quite the same degree of isolation.
Also, don't know about 80 degrees, but in the 60's there's definitely magnified warming both predicted and measured.
As for what they were smoking... back in 1978 it really could've been anything =)
Jan 26, 2010
Rank: 3.9 / 5 (7)
Interesting little fact after the conclusion of the report, in the smallest typeface so you might miss it ;-):
" This work was supported by funds from
the American Petroleum Institute (01-0000-4579)..
As Eric Idle would say "Say no more, wink wink, nudge nudge..
Jan 26, 2010
Rank: 1 / 5 (8)
Jan 26, 2010
Rank: 3 / 5 (2)
Jan 26, 2010
Rank: 1.5 / 5 (8)
That is funny considering that these same proxies also are the subject of emails and climategate documents. Funnier still is that Briffa is the source of the infamous 'Fudge Factor' used to get rid of declines and that both Briffa and Osborn files are present in said data.
No, in spite of any perceived errors or claimed problems with the Soon and Baliunas paper, it is the referenced papers themselves aside from the abovementioned paper that are of interest. Had I the funds or the funding I would stock my library with them. :)
Jan 26, 2010
Rank: 2.3 / 5 (3)
tintin.colorado.edu/CVEN5718/Readings/Mercer_Nature_1978.pdf
5K temperature raise in the next 50 years below antarctic circle. OK, less than 20 years left before we can confidently say: look your prediction (cited everywhere) is POS.
Jan 26, 2010
Rank: 2.3 / 5 (3)
Jan 26, 2010
Rank: 1.5 / 5 (8)
And...??? The work of the paper and synthesis was paid for in part with said funds. Fact is, Exxon and many other corporations also have their hands in AGW funding. Do a little searching and poking around.
The thing is, this funding does not apply to the materials that they referenced to put together the study. It is the underlying material that is of more interest.
Additionally, it is a fact--confirmed by climategate--that there are those active in trying to get funding cut off for scientists who do not toe the AGW line. I can easily see some scientists, when faced with the cutting off of their funding, add their voices to those who accused Soon and Baliunas of misusing their published data and papers.
That is not the behavioral model of true scientific inquiry, which certainly is not manifest in the climategate emails and documents.
Jan 27, 2010
Rank: 2.6 / 5 (5)
Anyway, back to the real world and away from one of Dachpys sockpuppets..is it real..an imposter..actually who cares..
The fact that this particularly poorly worked out paper was paid for by big oil is very relevant.
Back to topic and away from opinions, lets stick to facts, 2009 has been confirmed as the 2nd warmest year recorded by NASA http://www.giss.n...0100121/
Jan 27, 2010
Rank: 5 / 5 (6)
No. I've already put forth in a previous post, from what I've read the greenhouse over the Antarctic landmass itself is less effective: due to high albedo, and due to high obliqueness, the absorption of sunlight by the surface in the first place is much less efficient.
At the same time, the air mass over Antarctica is somewhat isolated from the rest of the atmosphere by the south polar vortex. So even as the enhanced greenhouse warms up the air in the 60's latitudes, this warmer air is prevented from intruding further down toward the pole. Nor, unlike with the Arctic, are there any ocean currents that approach the south pole. So overall, heat transport toward the south pole is much weaker, than heat transport toward the north pole.
In short, the greenhouse boost is not "negated", it just has less to work with over most of Antarctica.
Jan 27, 2010
Rank: 1 / 5 (7)
So it was warmer than 1998 or are you still going by the incorrect NASA figures that placed 98 ahead of 34 in the modern record?
Jan 27, 2010
Rank: 3.7 / 5 (7)
Oh dear oh dear, misreading facts...again! For the umpteenth time 1934 refers to the temperature of the continental USA, which comprises about 2% of the surface area of the earth.
If you had actually read the link, which you obviously hadn't before commentating on it, you will see that, according to NASA 2005 was the warmest year GLOBALLY. I quote "The past year was only a fraction of a degree cooler than 2005, the warmest year on record, and tied with a cluster of other years — 1998, 2002, 2003, 2006 and 2007 1998 and 2007 — as the second warmest year since recordkeeping began."
Next time do take the time to read before commentating, and try to remember who you are logged in as, that helps safe confusion ;-)
Jan 27, 2010
Rank: not rated yet
Jan 27, 2010
Rank: 1 / 5 (6)
Interesting. One group says 2009 is the second warmest. Another says it was the fifth warmest. Both claim to use the same data. Which group is right?
Jan 27, 2010
Rank: 1 / 5 (6)
To me that doesn't show a trend up or down.
Jan 27, 2010
Rank: 1 / 5 (7)
Hmmm... Yet another NASA website that states that overall 2009 was FIFTH warmest:
http://www.ncdc.n...t+Report
So, which is it: fifth or second? Of course, they probably haven't finished revising data on all of their pages yet so who knows what their final figure might be? They may yet find a way to make 2009 the all-time warmest. :)
Jan 27, 2010
Rank: 3.7 / 5 (6)
Err,NASA? don't you mean NOAA (I suppose they have four letters starting and ending the same, easy to mistake if you are incapable of reading thoroughly, of course they have different data collecting systems but heh..). Nice try at disinformation again..
Oh, and please remember to read posts correctly, notice my wording
Notice something...good, now tell me where i| mentioned NOAA?
Jan 27, 2010
Rank: 1 / 5 (1)
I can't entirely dismiss your argument, only cast some doubt upon. First, we are talking summer time, during which polar regions get the amount of solar radiation comparable to tropics. So obliqueness is a factor, but not the major one. The Antarctic albedo is 80% and I wonder if it accounts for inclination... Next, high albedo is not overwhelming factor either. The snow/ice albedo is the same as clouds, and the earth is covered by clouds 50% of the time (ref. any sat picture), whereas dry high antarctic plateau is almost always cloud free. Further, you suggest that the main channel for polar regions to warm up is convection from mid latitudes... I haven't seen this idea floating around in the literature, care to support it?
Jan 27, 2010
Rank: 3.3 / 5 (7)
http://earthobser...id=42392
Jan 27, 2010
Rank: 1 / 5 (6)
Actually, chalk it up to a mistype while in a hurry rather than trying deliberately to put out disinformation, as you claim. My apologies for mistyping while looking at two sites at the same time.
Actually, this is even better given that this rather egregious error of mine now stands corrected. So, the NOAA agrees with the MET that 2009 is 5th warmest. NASA says 2nd. Which one is right? Why?
Jan 28, 2010
Rank: 3.7 / 5 (7)
Try and read, you know, research the subject. Report back to my office with an essay, less than 1,000 characters on the difference between NOAA and NASA. Oh, and do double check your sources and please remember the difference in spelling between NOAA and NASA.
Thank you.
Jan 28, 2010
Rank: 1 / 5 (6)
Question is, why would their rankings be so different unless there's a faulty method of smoothing at play?
Jan 28, 2010
Rank: 1.6 / 5 (7)
I am asking you, MikeyK and sockpuppets, a direct question concerning the matter. I am asking which ranking/institution is right and why you think what you do.
So, again, which ranking is right and why do you think so? Please try to answer the questions rather than ranting.
As a side note, you and yours still have not answered the questions elsewhere relative to CO2 levels between the mid-Triassic and end of the Cretaceous, by the way.
Jan 29, 2010
Rank: 1.6 / 5 (7)