March 9, 2010 report
Google introduces its Public Data Explorer
(PhysOrg.com) -- Google's latest release is an application that allows users to create their own interactive, animated graphs and charts using public data such as census data or government statistics on unemployment or mortality rates. The charts and graphs created can then be embedded into web pages
The application is called the Public Data Explorer, and is built on the visualization technology Google obtained in 2007 when it acquired Trendalyzer. The same technology powers Google’s Chart Tools, which can be used to easily add graphs and charts to web pages.
Google statistician Jürgen Schwärzler, said the Public Data Explorer allows users to “mash up” data using different kind of graphs, charts and maps. Once a chart is prepared it is dynamic, and changes can easily be made, such as altering the scale or highlighting entries. The application makes it simple to embed the chart on a web page or blog, or share it with friends. It cannot be downloaded or exported yet, but Google is working on options to allow both.
The Google Public Data Explorer website allows users to play with the application, to select the data set and create animated visualizations that change over time. A number of examples already created demonstrate how the tool works. They include fertility rates in selected regions of the world, increase in per capita income in various counties of California, and rising unemployment in the US.
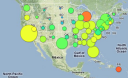
Unemployment in the U.S.
The Public Data Explorer is an extension of Google’s aim to add visual data such as charts to searches. Early last year, charts originating from the US census and the US Bureau of Labor Statistics were added to relevant search results. Then in November indicators derived from the World Bank were added. The new application adds a further five sources: the US Bureau of Economic Analysis, Eurostat, the US Center for Disease Control, the California Department of Education, and the Organization for Economic Co-Operation and Development (OECD).
The Public Data Explorer is at the experimental stage and was launched on March 8 in order for Google to gather feedback from users. A similar tool is already available for the Microsoft search engine, Bing.
This chart correlates life expectancy and number of children per woman for most economies of the world.
More information: www.google.com/publicdata/home
© 2010 PhysOrg.com


