Planck sees tapestry of cold dust (w/ Video)

(PhysOrg.com) -- Giant filaments of cold dust stretching through our Galaxy are revealed in a new image from ESA's Planck satellite. Analysing these structures could help to determine the forces that shape our Galaxy and trigger star formation.
Planck is principally designed to study the biggest mysteries of cosmology. How did the Universe form? How did the galaxies form? This new image extends the range of its investigations into the cold dust structures of our own Galaxy.
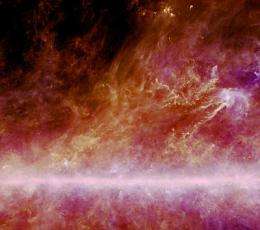
The image shows the filamentary structure of dust in the solar neighbourhood - within about 500 light-years of the Sun. The local filaments are connected to the Milky Way, which is the pink horizontal feature near the bottom of the image. Here, the emission is coming from much further away, across the disc of our Galaxy.
The image has been colour coded to discern different temperatures of dust. White-pink tones show dust of a few tens of degrees above absolute zero, whereas the deeper colours are dust at around -261°C, only about 12 degrees above absolute zero. The warmer dust is concentrated into the plane of the Galaxy whereas the dust suspended above and below is cooler.
"What makes these structures have these particular shapes is not well understood," says Jan Tauber, ESA Project Scientist for Planck. The denser parts are called molecular clouds while the more diffuse parts are 'cirrus'. They consist of both dust and gas, although the gas does not show up directly in this image.
There are many forces at work in the Galaxy to help shape the molecular clouds and cirrus into these filamentary patterns. For example, on large scales the Galaxy rotates, creating spiral patterns of stars, dust, and gas. Gravity exerts an important influence, pulling on the dust and gas. Radiation and particle jets from stars push the dust and gas around, and magnetic fields also play a role, although to what extent is presently unclear.
Bright spots in the image are dense clumps of matter where star formation may take place. As the clumps shrink, they become denser and better at shielding their interiors from light and other radiation. This allows them to cool more easily and collapse faster.
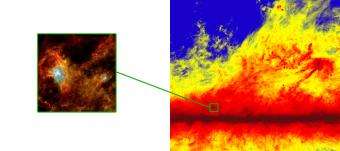
ESA's Herschel space telescope can be used to study such regions in detail, but only Planck can find them all over the sky. Launched together in May 2009, Planck and Herschel are both studying the coolest components of the Universe. Planck looks at large structures, while Herschel can make detailed observations of smaller structures, such as nearby star-forming regions.

One puzzle to be solved is why there is similar filamentary structure on both the large and the small scale. "That's a big question," says Tauber.
The new image is a combination of data taken with Planck's High Frequency Instrument (HFI), at wavelengths of 540 micrometres and 350 micrometres, and a 100-micrometre image taken in 1983 with the IRAS satellite.
The HFI data were recorded as part of Planck's first all-sky survey at microwave wavelengths. As the spacecraft rotates, its instruments sweep across the sky. During every rotation, they cross the Milky Way twice. Thus, in the course of Planck's mission to precisely map the afterglow of the big bang, it is also producing exquisite maps of the Galaxy.
Provided by European Space Agency


