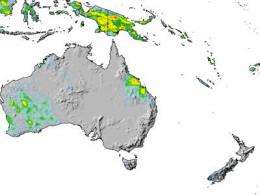
NASA's TRMM Satellite measures Cyclone Ului's Australian rainfall from space

NASA and the Japanese Space Agency's Tropical Rainfall Measuring Mission or TRMM satellite can estimate rainfall from space. TRMM is used to monitor tropical rainfall around the world, and can also calculate flood potential. TRMM data was used to create an animation of Tropical Cyclone Ului's track as it approached and made landfall in Queensland, Australia this weekend.
The TRMM animation of rainfall indicated that between 130 mm and 179 mm (5.1 and 7.0 inches) of rainfall fell in areas west of Collinsville, Queensland from Ului's landfall. TRMM data, along with information from other satellites, allows researchers to see how much rain is falling over most of the world every three hours and map areas of potential flooding. Maps that show areas of potential floods use precipitation radar data and high resolution measurements of water content of clouds made by microwave radiometers.
Those rainfall maps were made into a seven-day "movie loop" that allows users to track storms as they travel over land and oceans around the globe. The rainfall animations are developed in the Laboratory for Atmospheres of the NASA Goddard Space Flight Center, Greenbelt, Md. by the TRMM precipitation research team.
About 130mm (5.1 inches) or rainfall was estimated by TRMM at -20.38 latitude and 148.13 longitude, in Bogie, Queensland, Australia, near the Mount Aberdeen State Park. In Springlands, west of Collinsville, Queensland, near -20.88 latitude and 148.88 longitude, TRMM estimated a rainfall of 136mm (5.3 inches). At Mount Wyatt, 163mm (6.4 inches) of rain were estimated to have fallen, and southeast of Swan's Lagoon and Millaroo, TRMM estimated that 179mm (7.0 inches) of rain had fallen from Ului.
On March 20, Ului was a tropical storm with maximum sustained winds near 64 mph about 385 miles east of Cairns, Australia near 19.9 South and 151.7 East. Later in the day it brought sustained winds between 92-109 mph to Hamilton Island off Proserpine. By 2100 UTC (5 p.m. EDT) that day, Ului was 260 miles southeast of Cairns, Queensland, Australia with sustained winds near 52 mph (45 knots) . However, it briefly re-intensified with sustained winds near 109 mph before making landfall near Bowen at Airlie Beach.
Reports indicated that about 60,000 homes lost power and there was a lot of destruction to trees, houses, boats, power lines and sugar cane crops - a major crop in the region.
Ului headed west toward the Northern Territory where its rains have ended, and it is bringing only increased cloud cover and higher humidity. The Northern Territory may also see some isolated showers. As of March 22, all tropical cyclone watches and warnings were discontinued.
Provided by NASA's Goddard Space Flight Center


