May 17, 2011 report
Night sky satellite luminescence images used to estimate economic levels

(PhysOrg.com) -- Applying statistical analysis to a truly inspirational idea, economic researchers Xi Chen and William D. Nordhaus used nighttime satellite images taken by the U.S. Department of Defense over the period 1992-2008 to gauge the economic vitality of regions of the Earth that have little to no reliable sources of information to indicate how a country or region is doing; going on the assumption that lots of bright city lights generally indicates a lot of economic activity.
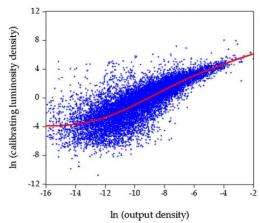
In their paper, published in the Proceedings of the National Academy of Sciences, they describe how they first developed mathematical and statistical models for analyzing areas of the planet by breaking down satellite images into individual cells, and then creating a scale of luminescence based on those cells. They then compared their results with actual data from easily obtained economic areas, such as the United States, Australia, and Canada and found that while their data did provide a general sense of where the busy or highly productive areas were, the numbers were not nearly as precise as those produced from actual measurements, were redundant, or sometimes revealed some pretty serious errors in their estimates. But, they did find that as they moved down the socioeconomic ladder to less populated or less developed areas, the numbers they were able to produce began to show more promise, going on the premise that some data is better than none at all. In some areas, the data also seemed to shed some light, if you will, on troubled regions, such as the Congo, where it is believed economic activity is going on, but because of the violence and instability, there has been no means to estimate how much.
The authors (and others) are quick to point out, however, that their models or indeed just looking at nighttime satellite images to gauge or guess how much economic activity is going on can be fraught with problems leading to estimation errors; the fact that some areas tend to shut down at night more so than others, (Salt Lake City for example) or are more spread out geographically, such as some of the countries in Africa, can lead to false assumptions.
The authors conclude by suggesting that their work shows that using geographical luminescence as a tool for estimating economic numbers, such as GDP, should in general be supplemented with data from other sources as much as possible, rather than be used as a standalone tool.
More information: Using luminosity data as a proxy for economic statistics, PNAS, Published online before print May 16, 2011, doi: 10.1073/pnas.1017031108
Abstract
A pervasive issue in social and environmental research has been how to improve the quality of socioeconomic data in developing countries. Given the shortcomings of standard sources, the present study examines luminosity (measures of nighttime lights visible from space) as a proxy for standard measures of output (gross domestic product). We compare output and luminosity at the country level and at the 1° latitude × 1° longitude grid-cell level for the period 1992–2008. We find that luminosity has informational value for countries with low-quality statistical systems, particularly for those countries with no recent population or economic censuses.
© 2010 PhysOrg.com


